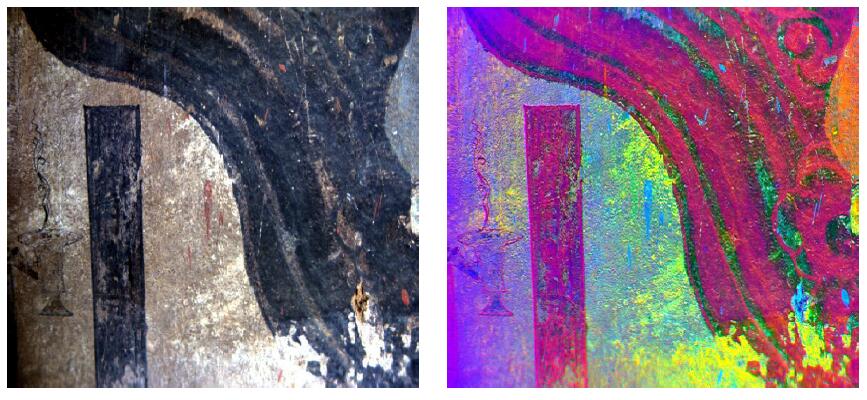
Analysis reports of mural text recognition based on hyperspectral imaging technology
In this paper, the hyperspectral data of the test object were collected by using the hyperspectral imager Gaia-Field (spectral range 400 nm -1000 nm) of Jiangsu Shuangli Hepu Technology Co. Ltd. The raw image data captured by the imaging hyperspectrometer are pre-processed, and the pre-processing process mainly consists of two parts. The first part is radiation calibration; the second part is noise removal. The first part is radiometric calibration, the calculation formula for radiation calibration is presentend in equation 1.
 (1)
(1)
Among them, Reftarget is the reflectance of the target, Refpanel is the reflectance of the standard reference plate, DNtarget is the value of the target in the original image, DNpanel is the value of the standard reference plate in the original image, and DNdark is the systematic error of the imaging spectrometer.
Next is the noise removal, this paper uses the more commonly used method of Minimum Noise Fraction Rotation (MNF) for noise removal. MNF is essentially two cascading principal component transformations. The first transformation (based on the estimated noise covariance matrix) is used to separate and recalibrate the noise in the data; this step results in noisy data with minimal variance and no inter-band correlation. The second step is the standard principal component transformation of the noise-whitened data (noise-whitened). For further waveform processing, the intrinsic dimensionality of the data is determined by examining the final eigenvalues and correlation images. The data space can be divided into 2 parts: one part is associated with larger eigenvalues and corresponding feature images, and the remaining part is associated with approximately the same eigenvalues and noise-dominated images. Since there is no whiteboard correction for this acquired hyperspectral image, the first step of data pre-processing radiometric calibration is not processed analytically, and the MNF noise reduction analysis is done directly. Figure 1 shows the changes of DN values in the imaged hyperspectral data before and after MNF noise reduction.
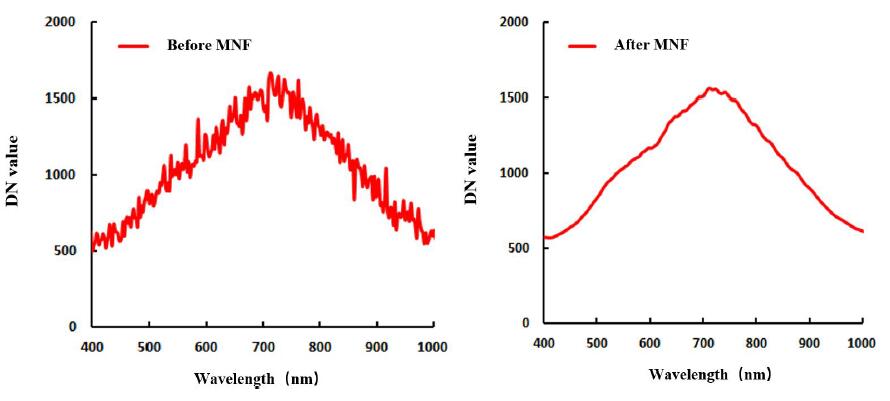
Figure 1 Changes in DN values of hyperspectral images before (left) and after (right) MNF transformation
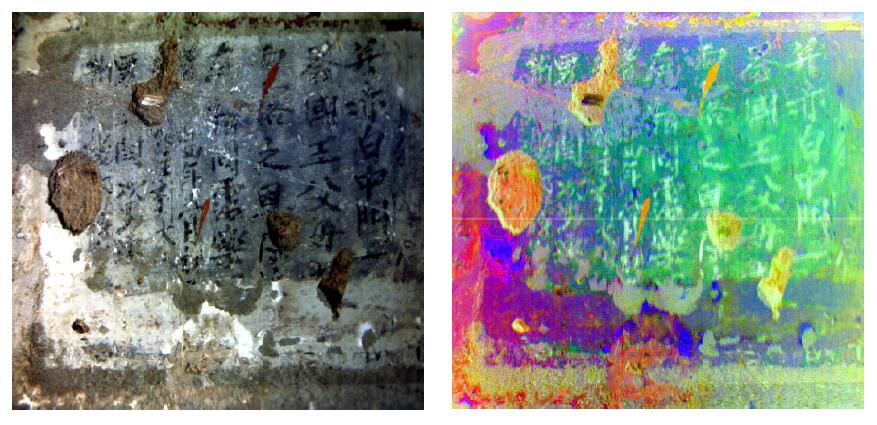
The following figures show the RGB (640 nm, 550 nm, 460 nm) true color synthetic data of the hyperspectral images of different components in the mural and the changes of DN at different positions in the images, respectively. From Fig. 2, it can be seen that the handwriting of the mural painting become blurred by natural corrosion, which changes the original spectral information and therefore increases the difficulty of identifying the corroded handwriting in the mural painting through spectral information.
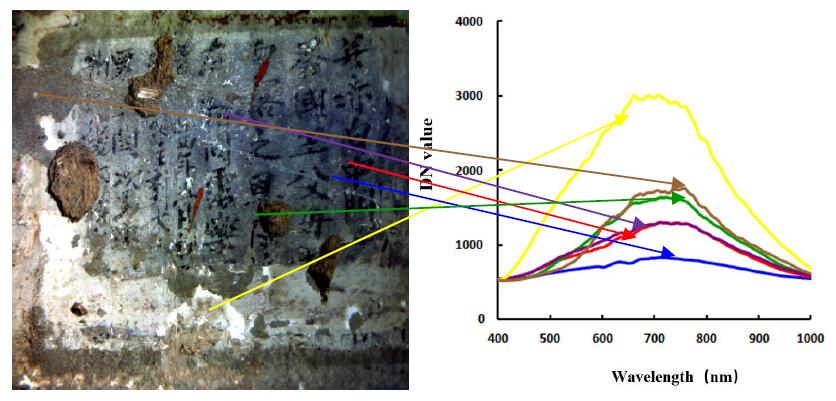
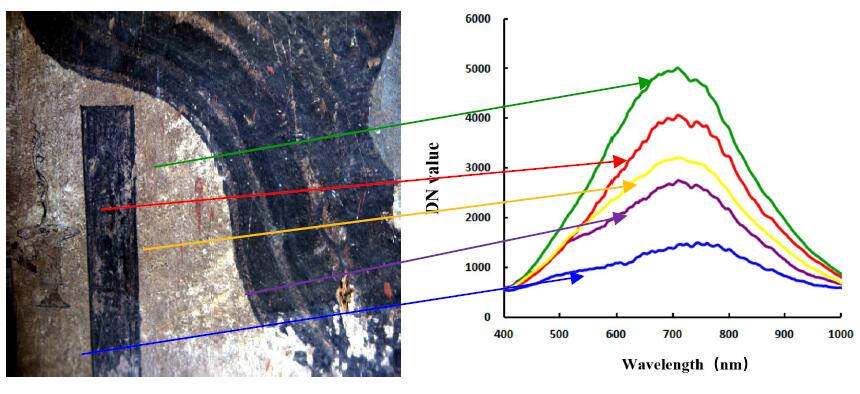
Figure 2 Variation of DN values for different components in the mural
The analysis-animate function of SpecView software was used to quickly browse the gray scale changes of the mural images in each wavelength band, and the results showed that the wavelength bands that can clearly identify the hyperspectral image information such as handwriting in the mural are mainly in the red and near-infrared regions, which is the same as the current research results at home and abroad. Taking the 730 nm band image as an example, the gray scale image of the mural at 730 nm was density segmented in order to more clearly distinguish the changes of the internal components of the mural, as showed in Figure 3. From Fig. 3, it can be seen that by density segmentation of a specific band of the imaging hyperspectral and assigning different colors, not only the changes of the components in the mural can be seen more clearly in the image, but also the changes in their values.

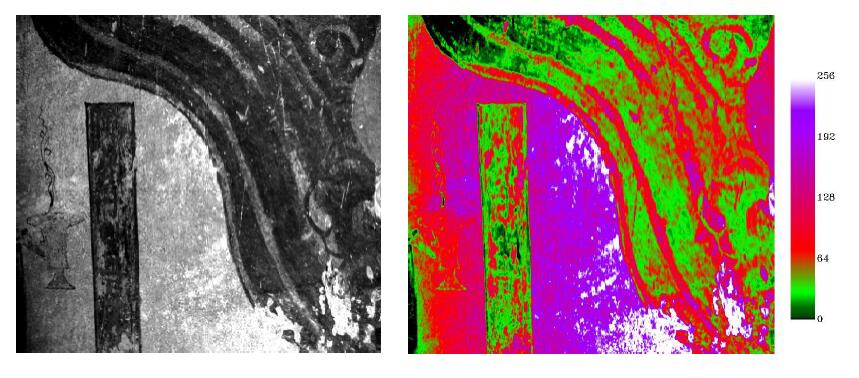
Figure 3 Density segmentation effect of the grayscale image of the mural at 730 nm
Fig. 4 Composite image before PCA change of the fresco
(Left R: 640 nm,G:550 nm, B: 460 nm; Right R: PCA2,G:PCA1, B: PCA3)
In order to objectively distinguish the variation of the internal components of the mural and the recognition of the mural handwriting, Principal Component Analysis (PCA) is performed on the pre-processed hyperspectral data to remove the redundant information between bands and compress the multi-band image information into a few converted bands that are more effective than the original bands. In general, the first principal component contains 80% of the variance information in the bands, and the first three principal components contain more than 95% of the information in all bands. Due to the uncorrelatedness among the bands, the foremost component bands can generate more colorful and better saturated color composite images. Fig.4 Compare and analyze the composite images of mural hyperspectral images before and after PCA changes, respectively.
From Figure 2-figure supplement 4, it can be seen that the text on the mural painting shows different clarity due to natural corrosion, and the DN value in the hyperspectral image of the corroded text is similar to the DN value of the text background, so it is difficult to identify the corroded text by spectral matching, supervised classification, unsupervised classification, decision tree, and mathematical morphology. In order to extract the text information on the mural, this paper tries to use principal component analysis to remove the redundant information between bands, compress the image information of multiple bands under a few converted bands that are more effective than the original bands, and combine them into RGB images using the band combination method, as shown in Figure 4, however, it can be seen from the figure that the RGB synthesized image of principal components still cannot identify the handwriting subject to natural corrosion; similarly, the use of a single band of the imaging hyperspectral for density segmentation to identify the corroded handwriting on the mural is also unsatisfactory.
However, it can be seen from Fig. 4 that the changes of the internal components of the mural can be shown more clearly after the combination of the bands of the main components of PCA and the density segmentation of the single band, so it is possible to use imaging hyperspectral technology to analyze the degree of corrosion of the mural.
In the natural world, there are many phenomena of homogeneous and heterogeneous spectra, and the traditional non-imaging hyperspectral techniques are difficult to distinguish the objects from each other. However, with the development of remote sensing technology, the feature of "map-spectrum integration" of imaging hyperspectral provides technical support to solve the problem of homogeneous and heterogeneous spectra. However, based on the characteristics of imaging hyperspectral , the handwriting in the image can be better extracted from the background by using the Mahalanobis Distance method, as showed in Figure 5.
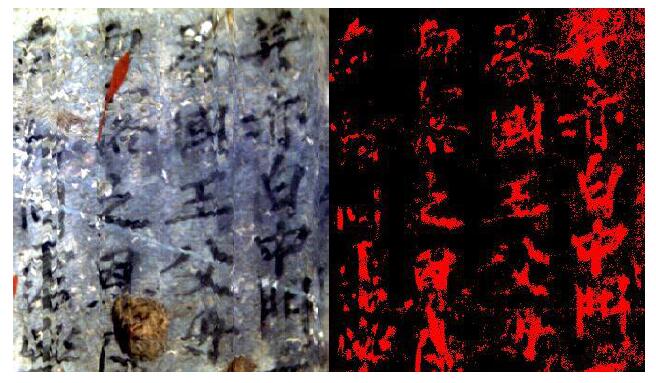
Figure 5 Hyperspectral image handwriting extraction
 13910278534
 010-56370168
 (1)
(1)


